Following the conclusion of an active crisis, CDR-derived indicators can support decision makers by providing insights into the short- and long-term recovery of affected areas.
In particular, indicators can be used to help assess whether displaced persons are returning to areas affected by the crisis and whether mobility within those areas is returning to pre-crisis levels.
Short-term
In the weeks following the crisis, we can use CDR data to estimate the number of people who have been ‒ and continue to be ‒ internally displaced by the crisis. These estimates of the number of IDPs can be calculated by region or summed for the whole country.
Similarly, we can generate indicators that describe the change in the distribution of a population relative to the distribution prior to the crisis. These indicators can identify areas which have experienced substantial decreases in population and those with substantial increases in population as people have been displaced. This information is useful for identifying vulnerable areas which may need support.
These outputs have been produced, for example, after the 2015 earthquake in Nepal and 2021 earthquake in Haiti. In Haiti, CDR indicators described the proportion of subscribers who had relocated from each communal section and the number of subscribers who had relocated to each communal section. From these indicators, it was possible to determine the areas which experienced the greatest displacement and the areas with the most IDPs.
In the short-term following a disaster, we can also use CDR data to estimate the numbers of IDPs returning to their pre-crisis home locations. This can provide important insights into the short-term recovery of affected areas and the number of people who will be displaced internally for an extended period of time.
We can also assess the recovery of areas after a crisis using indicators for the number of people visiting impacted areas and the mobility of people in affected areas. By comparing each of these indicators to a pre-disaster baseline, we can determine whether human mobility in these areas is continuing to be disrupted or is returning to a new normal. For example, the travel distance for subscribers in the departments of Haiti impacted by the earthquake in August 2021 decreased sharply following the earthquake and during the tropical storm that also affected the area shortly after. Similar decreases in mobility were also observed earlier in the year following Tropical Storm Elsa and the assassination of President Jovenel Moïse.
Long-term
We can use CDR indicators to continue to monitor the recovery from a crisis in the longer-term, over the months after the end of the crisis. Indicators describing the distribution of the population and their mobility patterns can provide on-going updates on whether impacted areas are returning to their pre-crisis ‘normal’ or whether the vulnerability of some areas persists, requiring continued support.
CDR indicators can also support long-term planning for humanitarian aid.
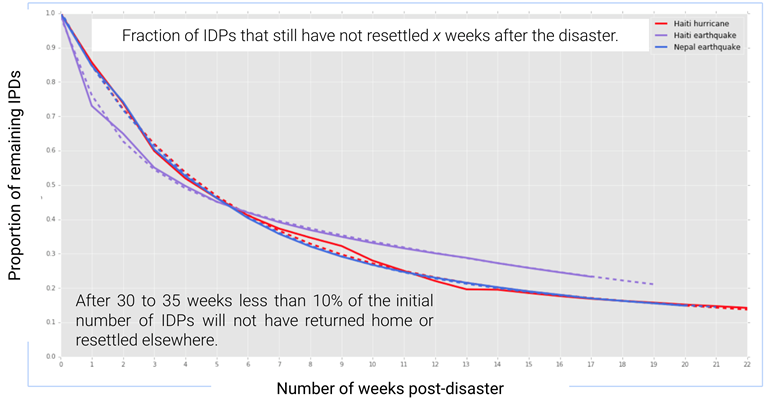
Research by Flowminder has demonstrated that the rate of decline in the number of IDPs was similar across three different natural disasters, the 2010 earthquake and 2016 Hurricane Matthew in Haiti and the 2015 earthquake in Nepal. This rate could be used to predict the number of people who will continue to be displaced and require support after the conclusion of other, similar crises in future.
However, this assumes that the declining number of internally displaced displaced people over time following other crises follows a similar trajectory. Comparison to a large number and broad range of crises will help us better determine how much this rate varies and therefore how well people’s return to areas affected by crises can be predicted.


